Visualisation of Factors
This post shows some ways to illustrate numbers for the purpose of investigating prime number patterns (surprise, it failed). It’s pretty basic but it’s still interesting enough to demonstrate and maybe it will inspire others to mess with numbers.
Imagine you had a bunch of equally-sized N squares. If you are able to arrange the squares so that they form a rectangle, then you are able to describe N in terms of a width multiplied by a height. This means that those numbers are factors of N.
Below is a grid representing all possible pairs of natural numbers through intersections of the grid lines. The origin (0,0) is at the bottom left corner. Below is a rectangle of size 10, with a corner at point (2,5).
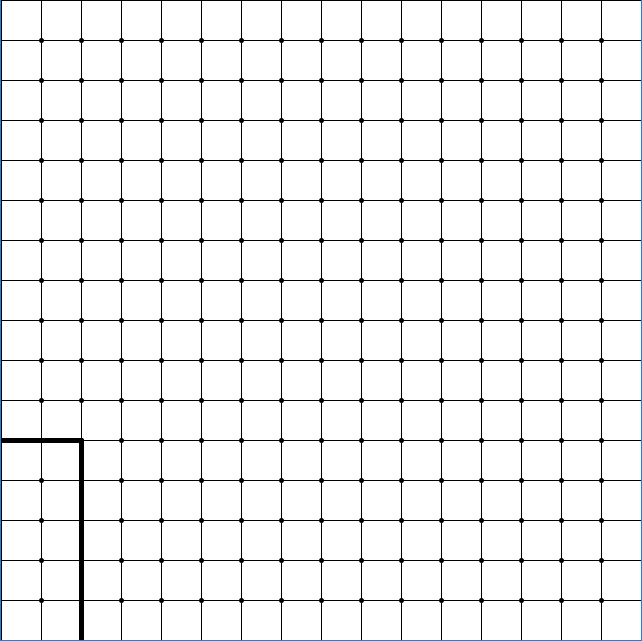
If you think about it, a prime number represented by a rectangle can only have a width or height of 1. This means that every point on this grid except for those on x = 1 or y = 1 represents a rectangle with a size of a composite number. Not every composite number exists in this region, but it is guaranteed that no primes exist here.
The following image is a visual representation of different factors of 6.
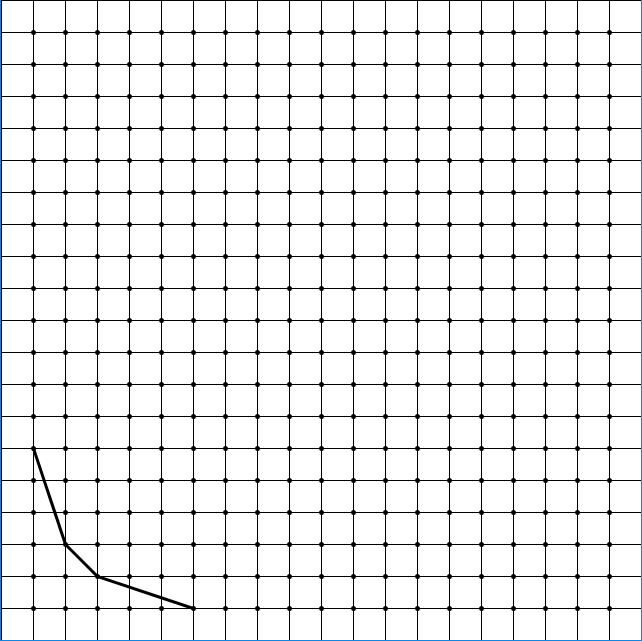
There are three connected lines over 4 points. Each point is a different factorization of 6; (1, 6), (2, 3), (3, 2), and (6, 1). These points are connected through lines. Here is what the first 5 prime numbers look like using this visualization.
Prime numbers only have two factors: itself and 1, hence the single line connecting the two points.
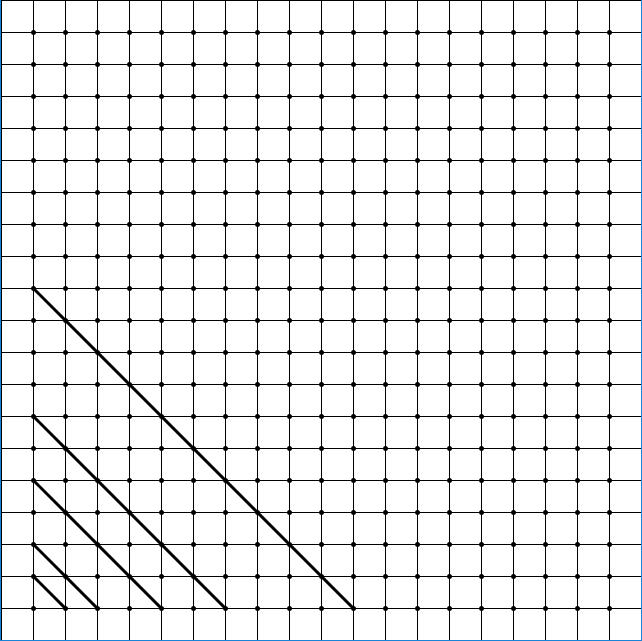
Next, draw all the composite numbers 4 through 12.
This looks…. messy. There is overlap between lines of different composite numbers, but it’s not because different composite numbers share similar factors. Remember that we are only visualizing pairs of factors. Every composite number has a unique set of pairs of factors. No other number than 12 has the pair of factors (1, 12), (2, 6), (3, 4), (4, 3), (6, 2), and (12, 1). However, as we’ve seen, pairs of factors can equate to the same number.
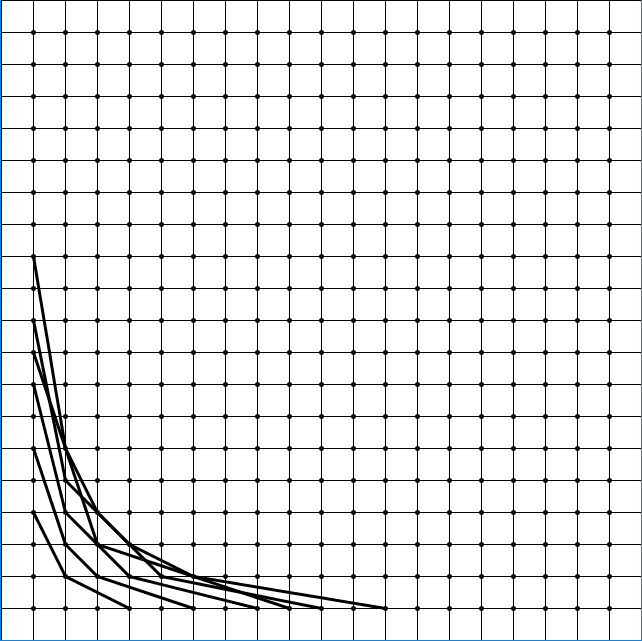
We can avoid this crossing issue by not using straight lines and using curves instead. It is actually possible to draw all composite number’s curves without any two curves crossing each other. Curves that are closer to the top and to the right correspond to a higher number.
Now there’s actually a very useful function that can be used to help draw these lines: the 1/x family. Here’s an example: y = 12/x. If x = 2, then y = 6. If x = 3, then y = 4. If x = 4, then y = 3. See why this is useful? All we have to do is put in some composite number (like 12) in the numerator of this fraction, and if the resulting graph passes through a point in the grid, then that point is a factor pair of the number we put in! Technically, every (x,y) point that satisfies y = 12/x is a factor of 12, but we are only interested in factors that are natural numbers.
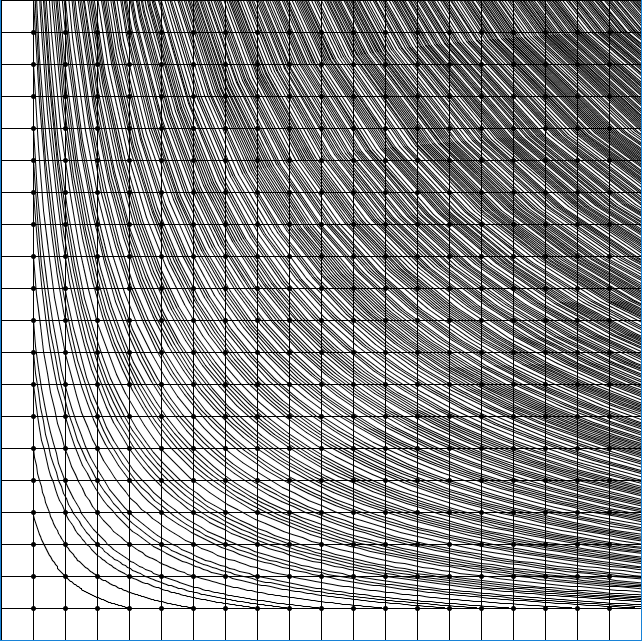
Boom. All composite numbers are graphed up to 500, and none of the lines cross each other. In addition, every point visible not in x = 1 nor y = 1 has a line crossing through it (the maximum visible point is at (20,20), and 20x20 < 500).
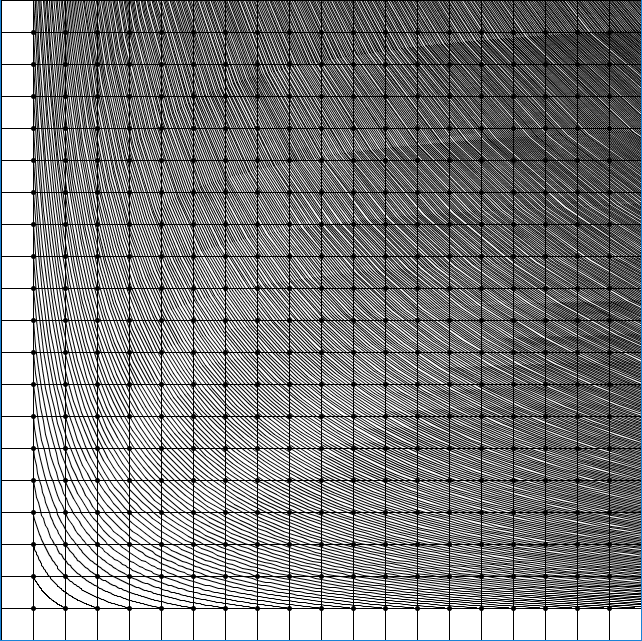
For the sake of completion, the following is a graph with all numbers…
And a graph with only prime numbers. Notice how none of these lines cross any points except for those at x = 1 and y = 1.
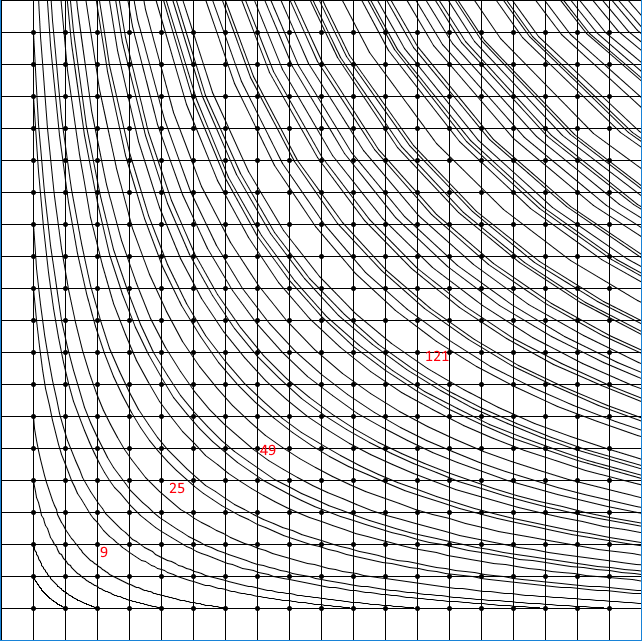
You can also kind of see prime gaps this way. Two lines that are as close as they can be have a prime gap of 2, for example.
The red numbers are examples of a number between two primes. For example, the two lines between 25 represent the prime numbers 23 and 29.
Is this it? There’s not much left to analyze from these graphs at face value. There’s just one more interesting property I’d like to share.
Take a graph line for any number (say, 6). Find all the points that line crosses. For every point found on the line, log the distance between that point and the previous point. For example, the graph line for 6 intersects with points (1, 6), (2, 3), (3, 2), and (6, 1). The distance will be calculated by summing the differences in x values with the differences in y values. So, the distance between (1,6) and (2,3) is 1 + 3 = 4. The distance between (2, 3) and (3, 2) is 1 + 1 = 2. The distance between (3, 2) and (6, 1) is 3+1 = 4. The distances 4, 2, and 4 sum up to 10. The following shows a bunch of distances between points for a number and the sum of their distances starting from 2.
2: 2         -> 2
3: 4         -> 4
4: 3,3       -> 6
5: 8         -> 8
6: 4,2,4     -> 10
7: 12        -> 12
8: 5,4,5     -> 14
9: 8,8       -> 16
10:6,6,6     -> 18
11:20        -> 20
12:7,3,2,3,7 -> 22
13:24        -> 24
14:8,10,8    -> 26
15:12,4,12   -> 28
16:9,6,6,9   -> 30
…
N: -> (N-1) * 2
The sum of all distances for any number N is N subtracted by 1, then multiplied by 2.
Edit 1: This property is actually not as interesting as I’m making it out to be. Bonus points if you can figure out why!
Unfortunately, I couldn’t find anything else that was interesting about formatting the data like this. As you may know, it is a very difficult task to find any kind of pattern in prime numbers, as they kind of lack a pattern by definition. Hopefully this was interesting enough for others to get inspired about messing with numbers.
Here is the source code I used for my efforts. The program is meant to be used for Processing.
final int GRID_LINE_COUNT = 16; //change this if you want a larger graph
final int SCREEN_SIZE = 640;

void setup() {
 size(640,640);
}

void draw() {
 background(255);
 //vertical and horizontal grid lines.
 strokeWeight(1);
 for (int i = 0; i < GRID_LINE_COUNT; i++) {
    drawGridLine(i, 0, i, GRID_LINE_COUNT);
    drawGridLine(0, i, GRID_LINE_COUNT, i);
 }
 strokeWeight(5);
 for (int i = 1; i < GRID_LINE_COUNT; i++) {
   for (int j = 1; j < GRID_LINE_COUNT; j++) {
     drawGridPoint(i, j);
   }
 }

 strokeWeight(1);
 //draw these 1/x lines!
 for (int i = 2; i <= 270; i++) {
   if (stupidCompositeCheck(i)) {
     drawInverseLine(i, 100);
   }
 }
}

boolean stupidCompositeCheck (int num) {
   if (num == 2) {
      return false;
   }
   for (int i = 2; i < Math.sqrt(num) + 1; i++) {
     if (num % i == 0) {
        return true;
     }
   }
   return false;
}

void drawInverseLineRange (int num, int min, int max) {
  //start at (1, num) and end at (num, 1)
  float previous = min;
  float current = min;
  for (float i = 0; i <= 20; i++) {
      previous = current;
      current = ((i * (max - min))/ 20) + min;
      drawGridLineInverted(previous, num / previous, current, num / current);
  }
}

//crude algorithm to draw a y = 1/x variant with a bunch of straight lines
void drawInverseLine (int num, int pointNumber) {
  //start at (1, num) and end at (num, 1)
  float previous = 1;
  float current = 1;
  for (float i = 0; i < pointNumber; i++) {
      previous = current;
      current = ((i * (num - 1)) / pointNumber) + 1;
      drawGridLineInverted(previous, num / previous, current, num / current);
  }
}

void drawGridPoint (int x, int y) {
  point(SCREEN_SIZE * x / GRID_LINE_COUNT, SCREEN_SIZE * y / GRID_LINE_COUNT);
}

void drawLineViaPoint (int x, int y) {
 drawGridLineInverted(0, y, x, y);
 drawGridLineInverted(x, y, x, 0);
}

void drawGridLineInverted (int x1, int y1, int x2, int y2) {
  drawGridLine(x1, GRID_LINE_COUNT - y1, x2, GRID_LINE_COUNT - y2);
}

void drawGridLine (int x1, int y1, int x2, int y2) {
  line (SCREEN_SIZE * x1 / GRID_LINE_COUNT, SCREEN_SIZE * y1 / GRID_LINE_COUNT,
        SCREEN_SIZE * x2 / GRID_LINE_COUNT, SCREEN_SIZE * y2 / GRID_LINE_COUNT);
}

void drawGridLineInverted (float x1, float y1, float x2, float y2) {
  drawGridLine(x1, GRID_LINE_COUNT - y1, x2, GRID_LINE_COUNT - y2);
}

void drawGridLine (float x1, float y1, float x2, float y2) {
  line (SCREEN_SIZE * x1 / GRID_LINE_COUNT, SCREEN_SIZE * y1 / GRID_LINE_COUNT,
        SCREEN_SIZE * x2 / GRID_LINE_COUNT, SCREEN_SIZE * y2 / GRID_LINE_COUNT);
}